Graffito
On
by Deane Madsen
I saw this on a wall near my house:

Makes me think the area is gentrifying! Oh, and that reminds me:

I saw this on a wall near my house:
Makes me think the area is gentrifying! Oh, and that reminds me:

With Rumble out of the way, we’ve figured out the details of the five “pavilions” for our Ultra Expo exhibition, the final project for Sylvia Lavin’s class of the same title, to be held at JANM from July 13th-20th. Above is the flier for the event, which has been a long ten weeks in the making. Hope you’ll be able to join us!
Here’s the vinyl graphic I was working on for the US Pavilion:

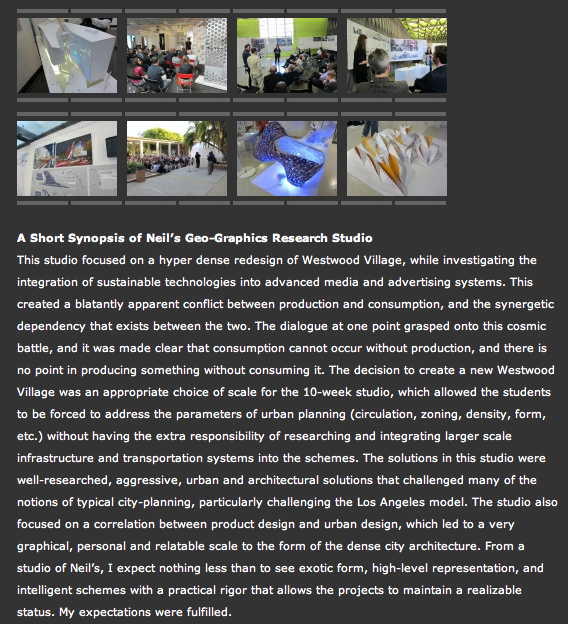
A classmate noted that our studio was one of the topics covered in a recent blog post by Rennie Tang & Houston Drum about UCLA’s Rumble:
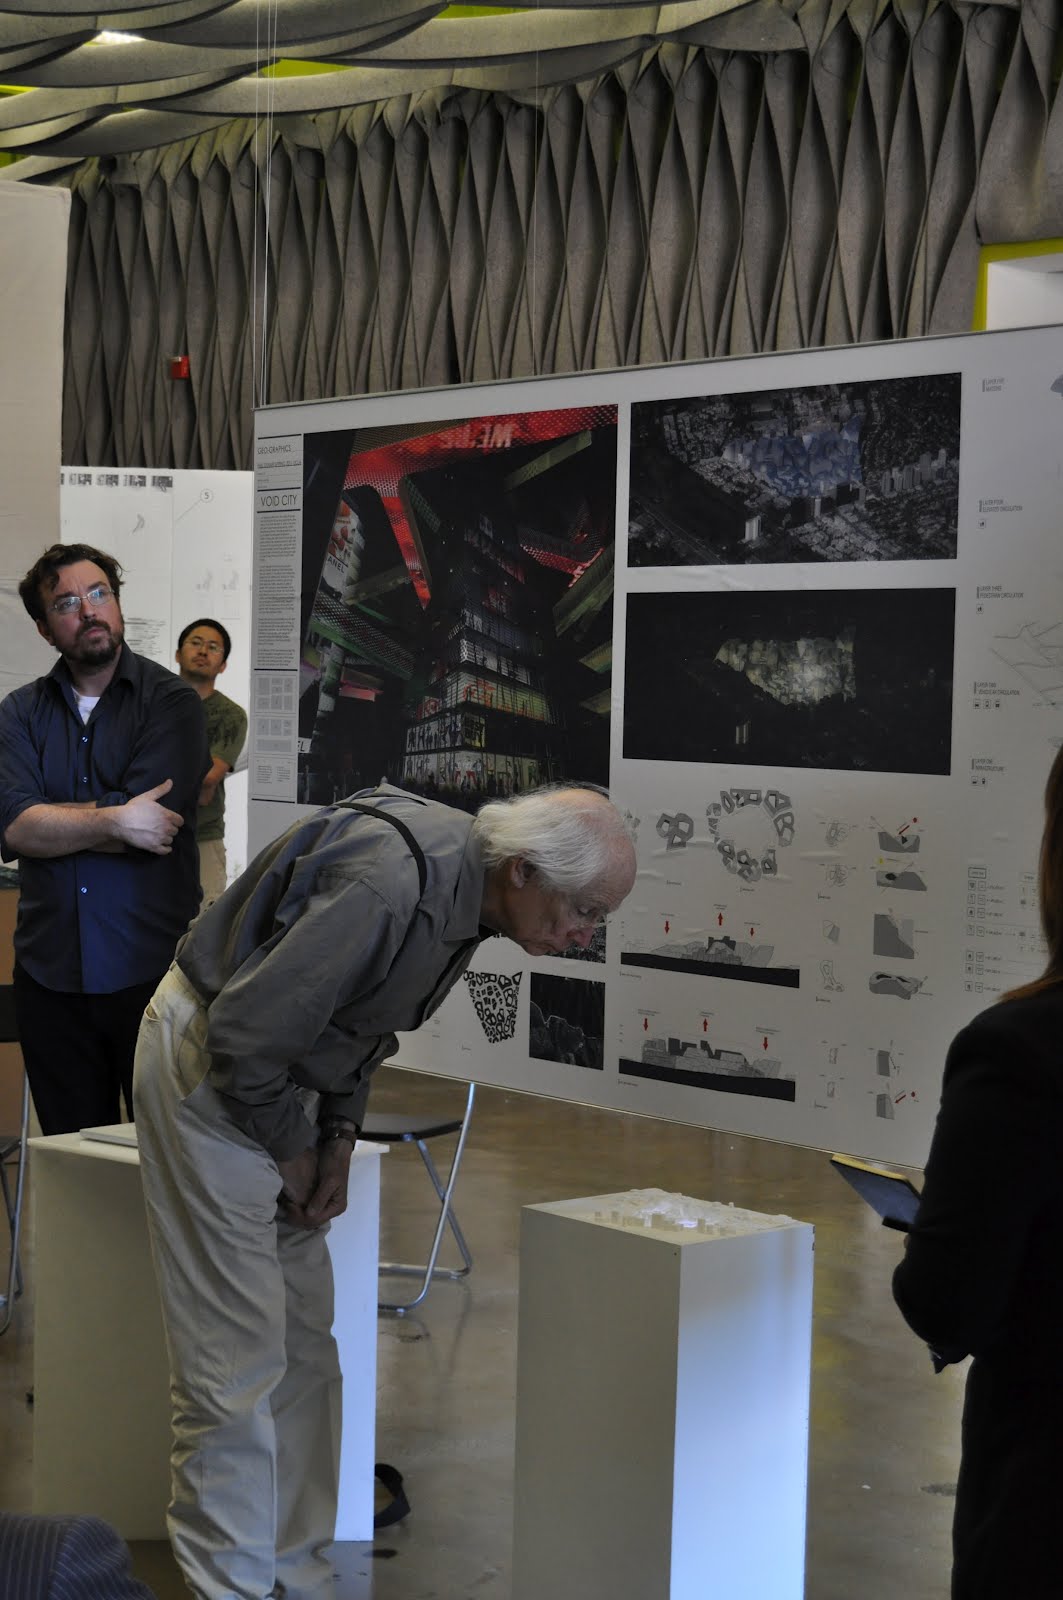
We have a 3d print of our site that we wanted to display for Rumble – we got it from Shapeways, and it just barely arrived in time. The cool thing about the 3d print, though, is that it came out translucent, thanks to its minimal thickness. I’d laid claim to the 3d printing process, and so it fell to me to design the stand upon which the model sat. I thought it might be fun to play with the translucency in the base for the stand, and developed the following concept:
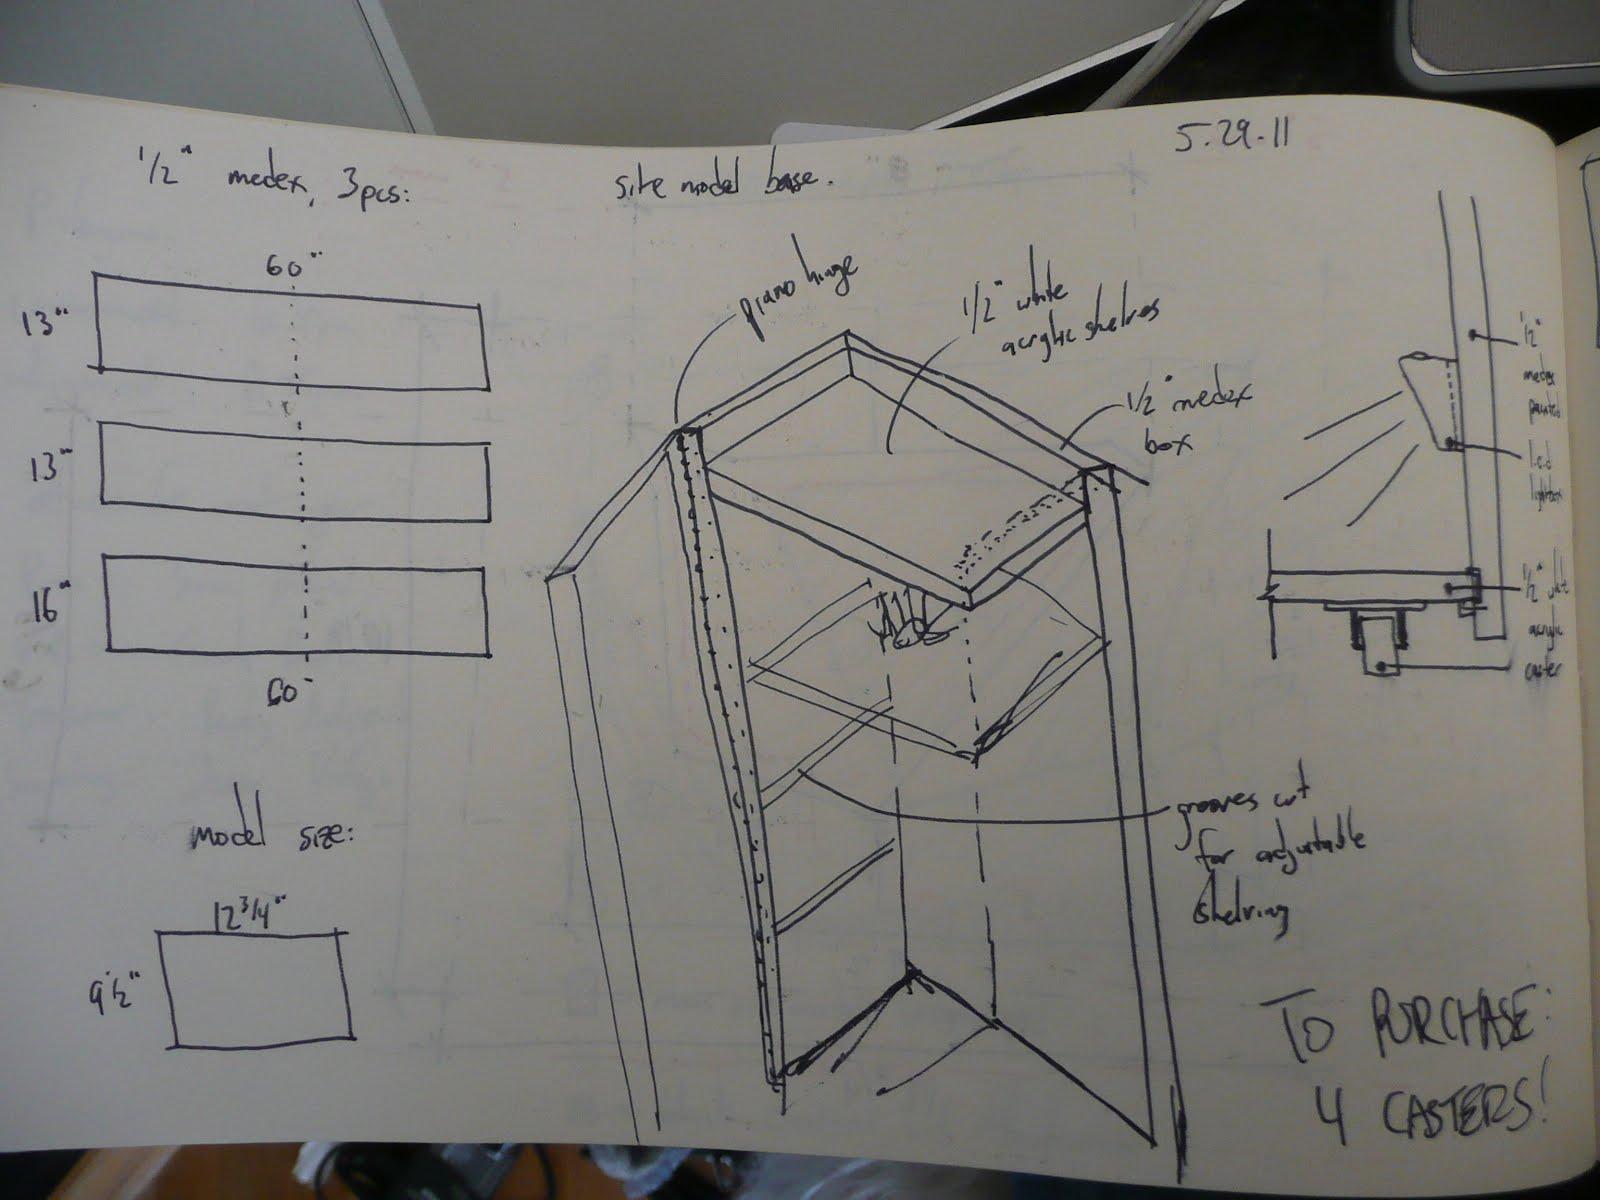
Basically, it involved building a model stand fitted to the 3d print, with hidden casters so we could move it around, and an opaque white acrylic top to diffuse light from below. The setup would also involve a door on the backside of the stand, so that lights could be turned off when not in use, and a shelf upon which the lights would rest. Here’s the finished product from above:
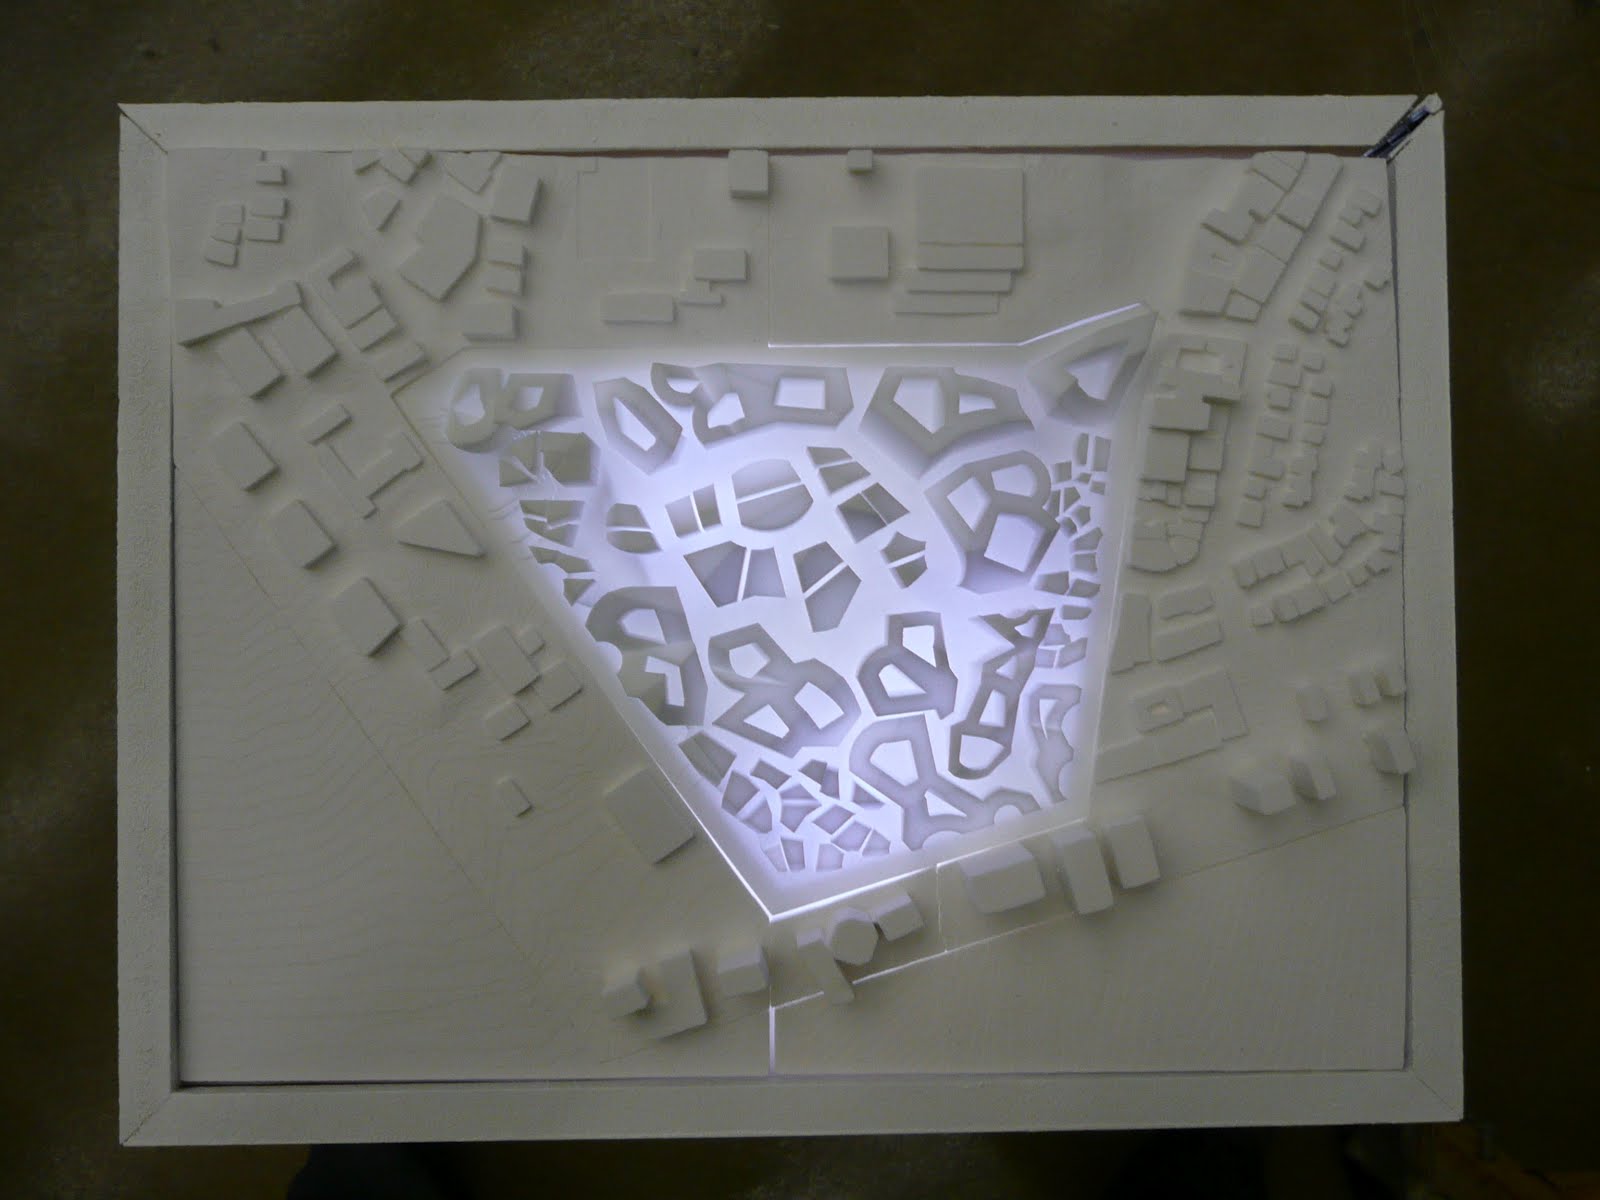
And here’s Richard Weinstein taking a closer look:
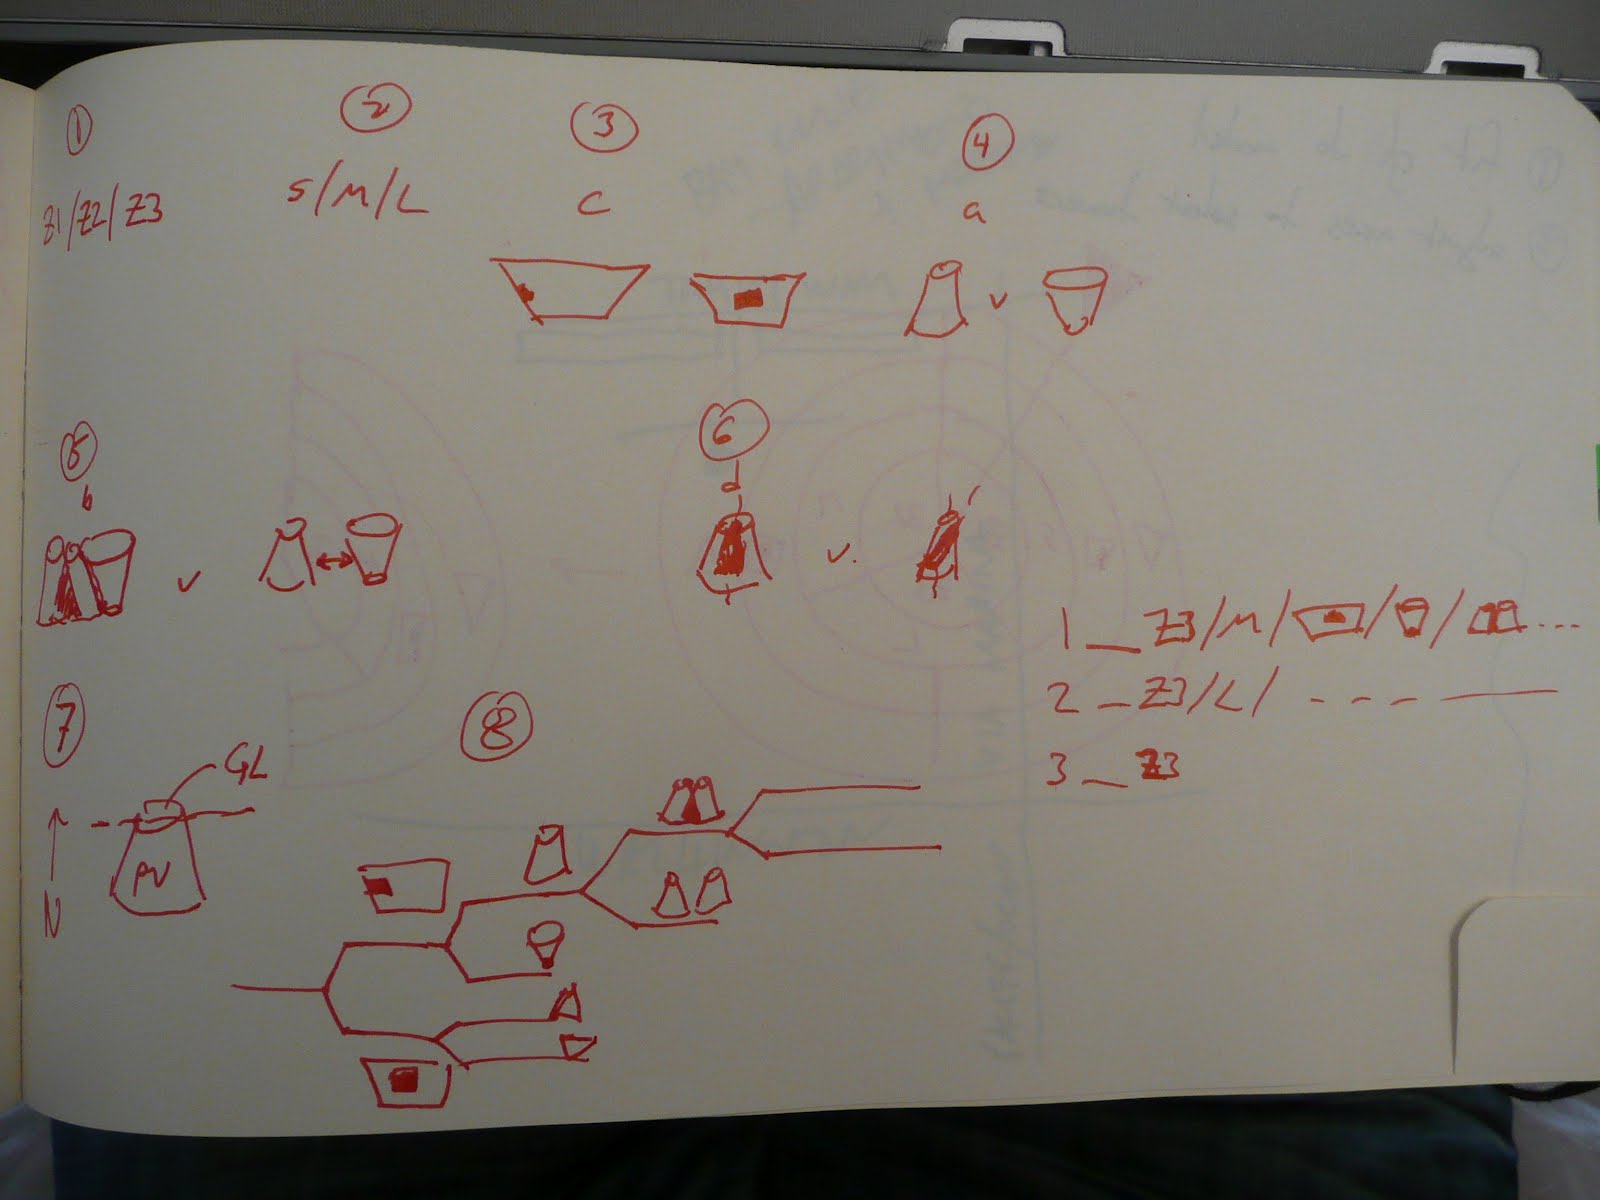
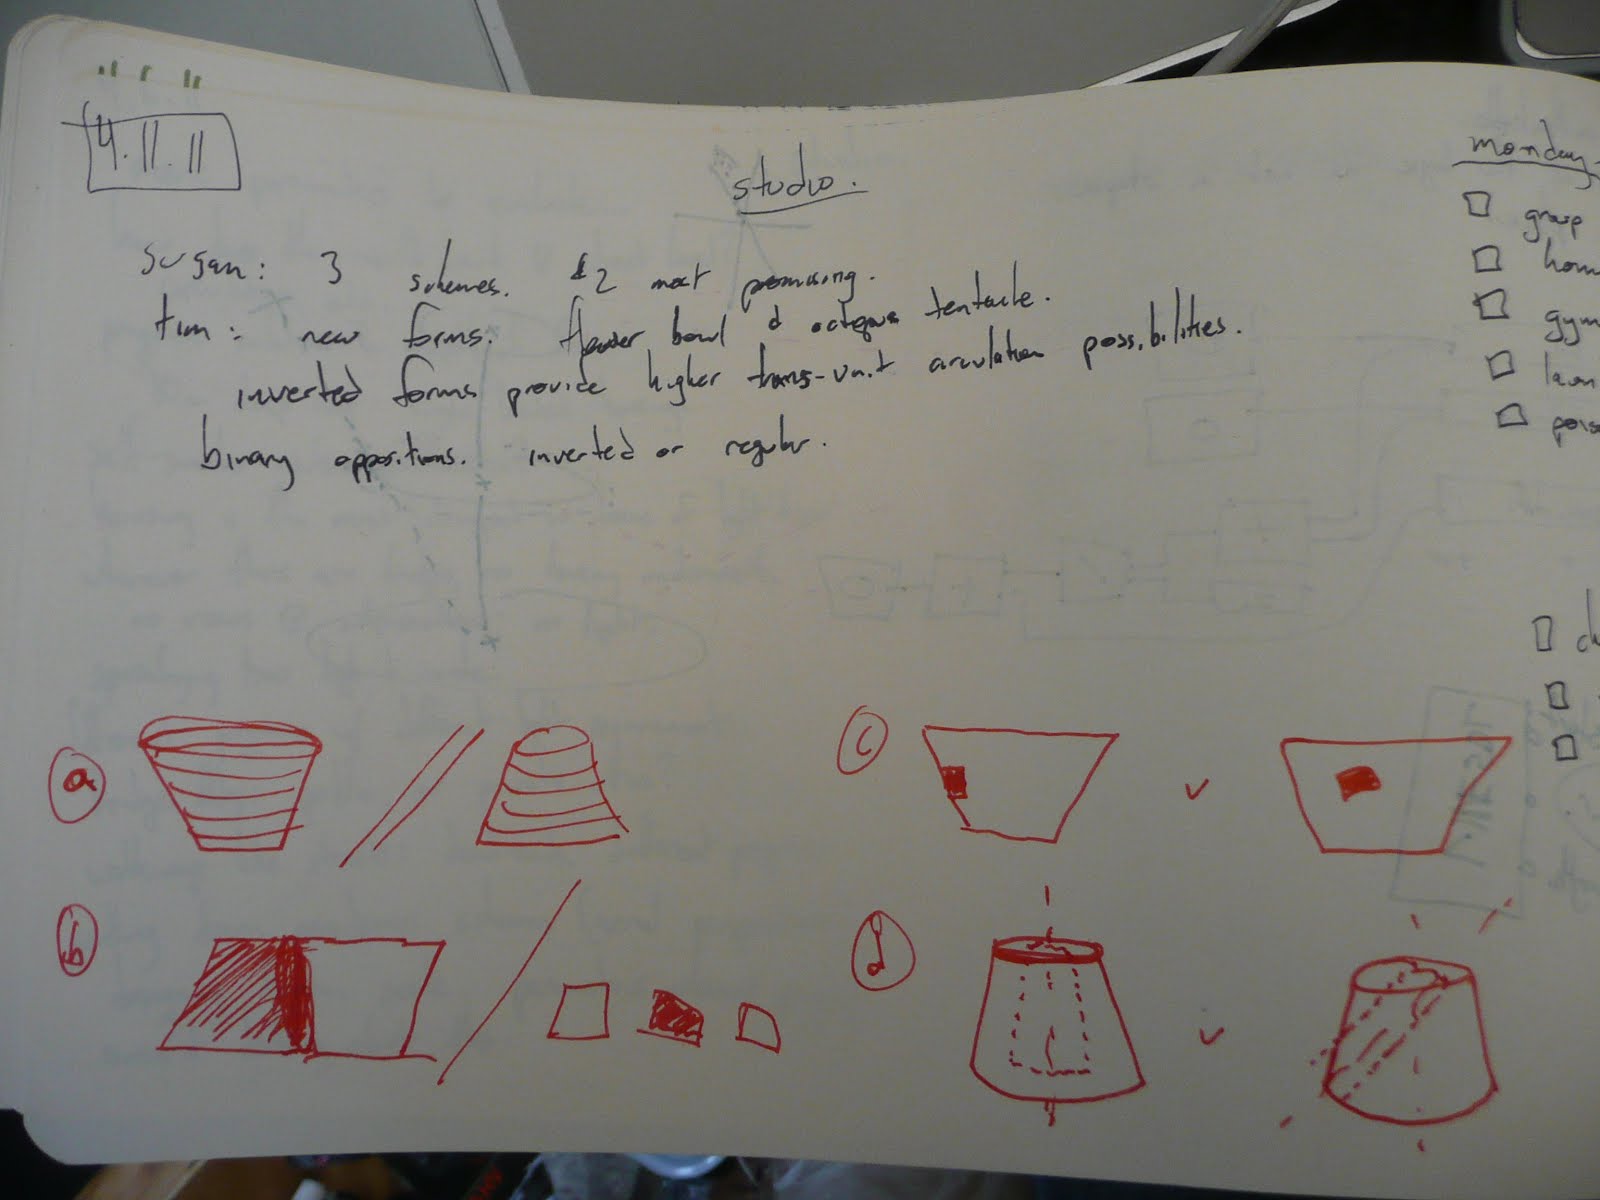
In an effort to categorize what we’ve been doing, we have diagrammed a few different typologies. Right now it’s all stemming from these iterations of Grasshopper manoeuvres, so we have the following classifications:
a) inverted v. regular
b) intersecting v. separate
c) edge condition v. landlocked
d) axis-normal v. axis-tilted
I made some super-quick dumb diagrams to illustrate the differences:
This led to a differentiation of zones, and another classification system. The zones are an effort to maximize southern exposure, such that buildings in the southern-most zone, Zone 1, don’t get too tall to block buildings in Zone 2, and buildings in Zone 2 don’t block buildings in Zone 3. Within each zone, there are small, medium, and large buildings, each size of which would probably correspond to different programs across the zones. A small in Zone 1 would still be smaller than a small in Zone 2, if that makes sense. We were thinking about trying to use our diagrams to codify each building, so that by reading icons, one might be able to tell what decisions had informed its shape, size, axial orientation, etc. – and we came up with this resulting diagram: