Charting Building Shapes
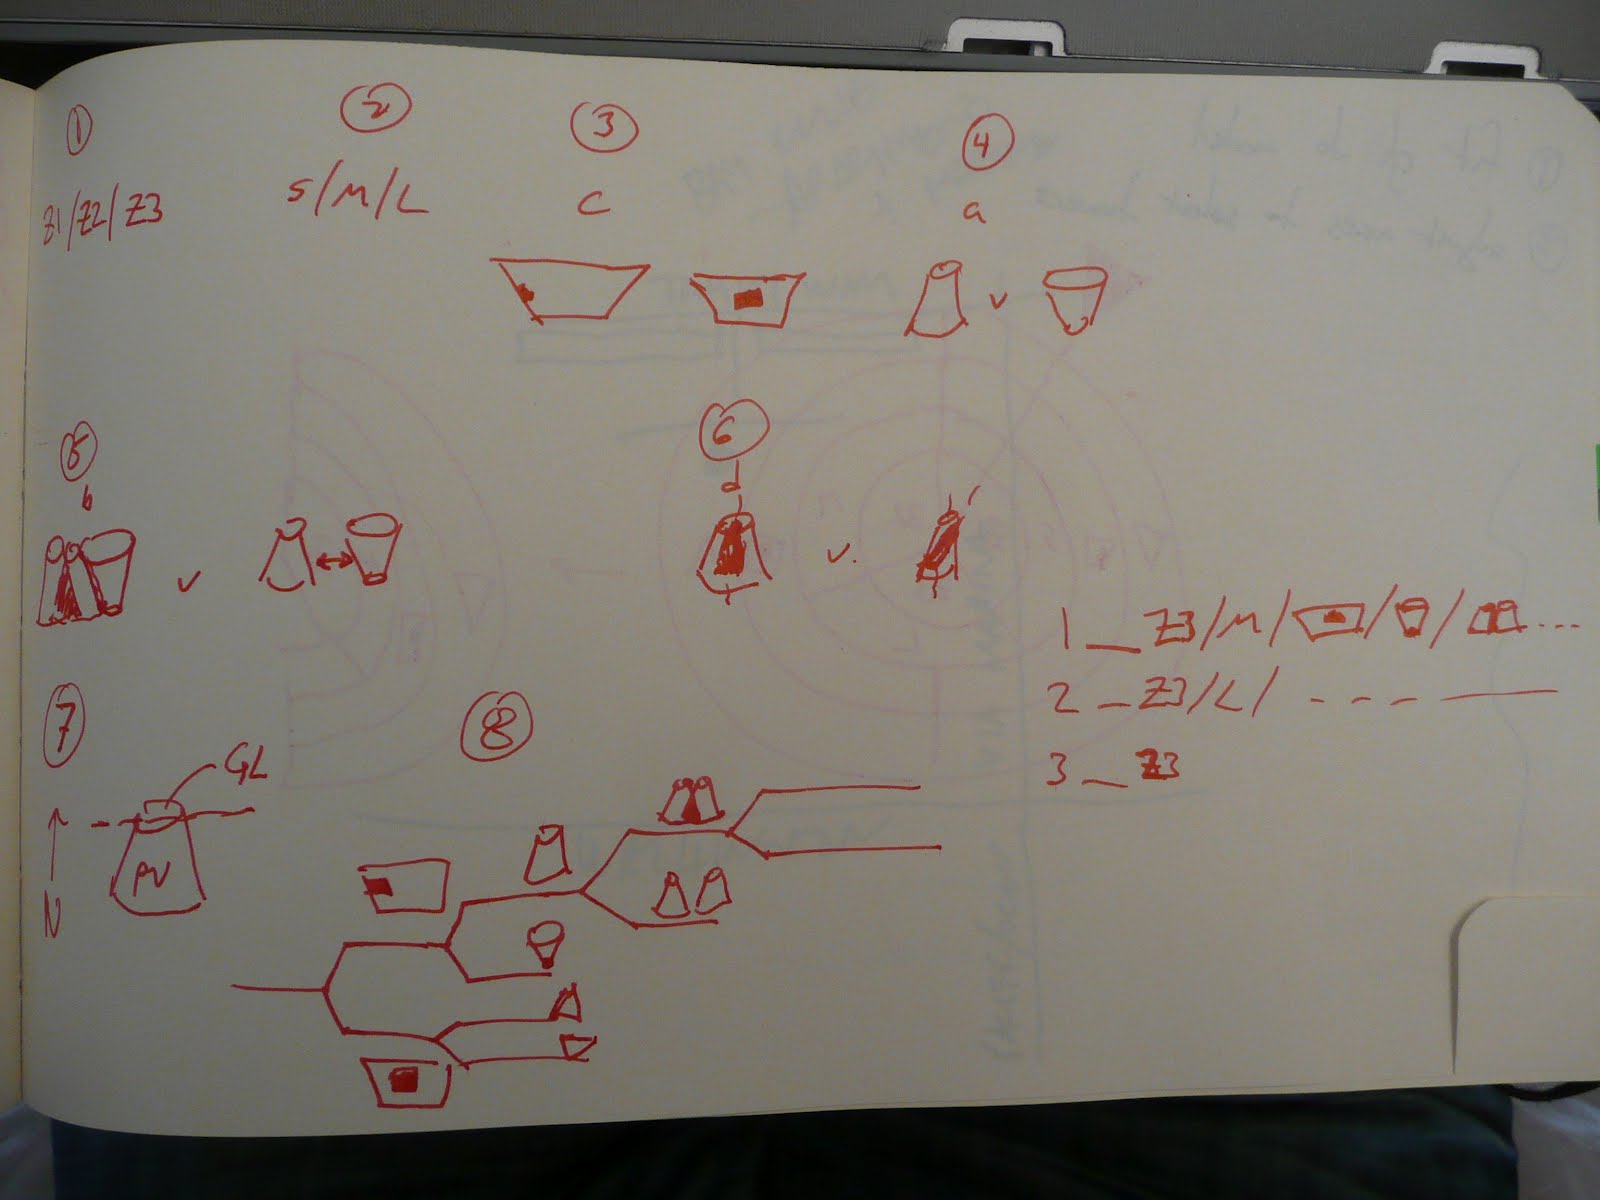
In an effort to categorize what we’ve been doing, we have diagrammed a few different typologies. Right now it’s all stemming from these iterations of Grasshopper manoeuvres, so we have the following classifications:
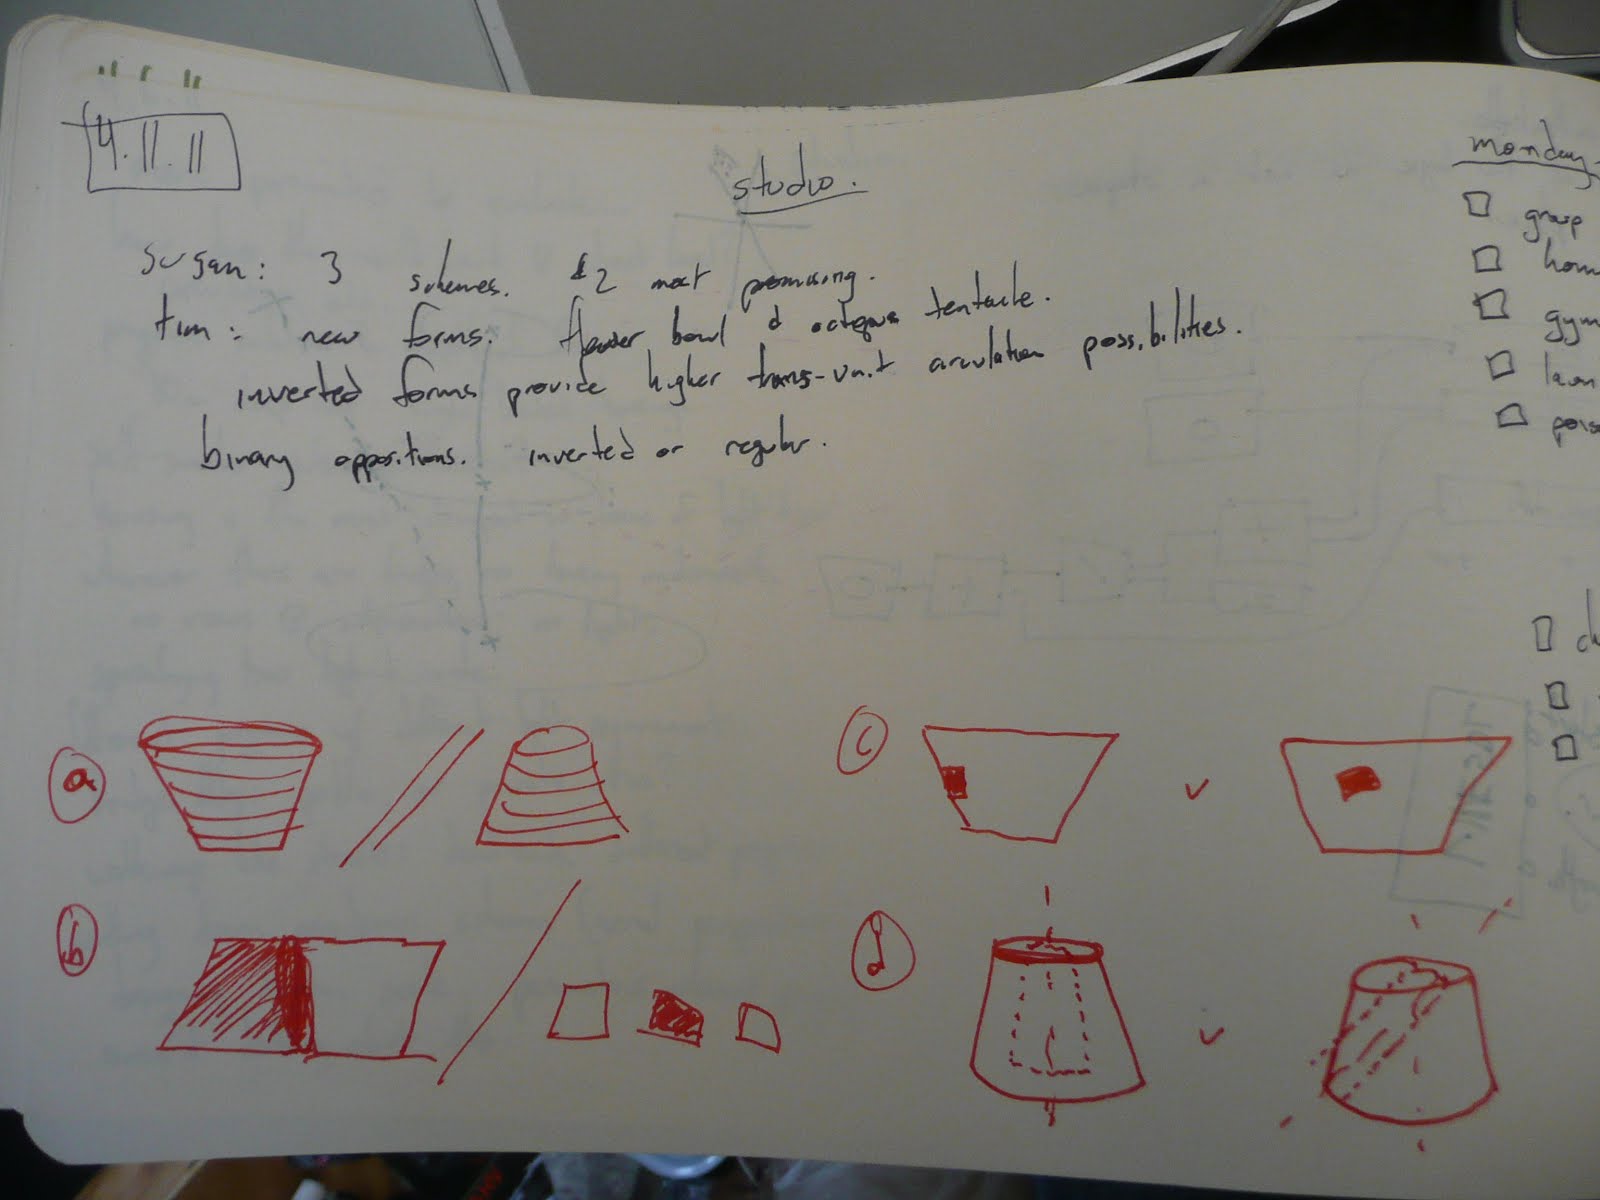
a) inverted v. regular
b) intersecting v. separate
c) edge condition v. landlocked
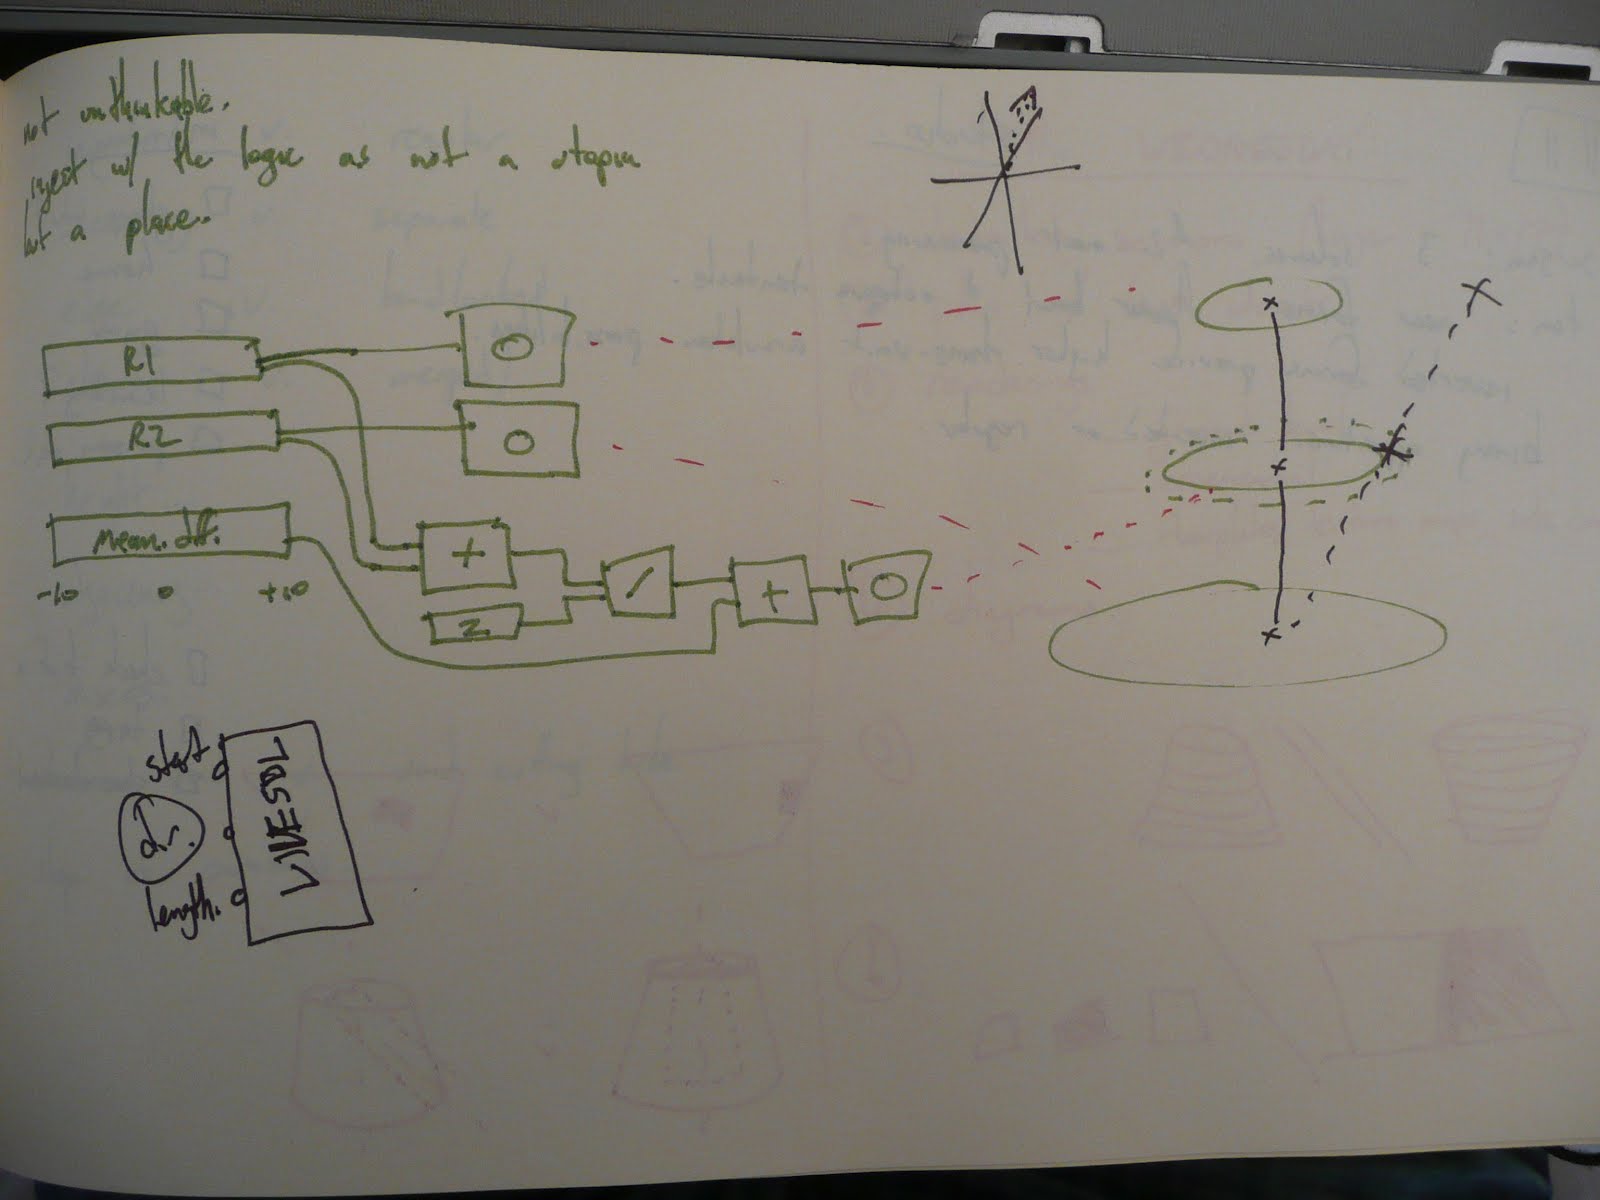
d) axis-normal v. axis-tilted
I made some super-quick dumb diagrams to illustrate the differences:
This led to a differentiation of zones, and another classification system. The zones are an effort to maximize southern exposure, such that buildings in the southern-most zone, Zone 1, don’t get too tall to block buildings in Zone 2, and buildings in Zone 2 don’t block buildings in Zone 3. Within each zone, there are small, medium, and large buildings, each size of which would probably correspond to different programs across the zones. A small in Zone 1 would still be smaller than a small in Zone 2, if that makes sense. We were thinking about trying to use our diagrams to codify each building, so that by reading icons, one might be able to tell what decisions had informed its shape, size, axial orientation, etc. – and we came up with this resulting diagram: